Line plot
• Line plot is a graph shows how many times something happened.
• It is a graph that shows the data as X's above a number line.
Example
The following table shows the marks of students in an exam :
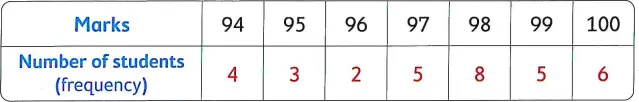
You can show these data using a line plot as follows :

From the graph :
• The number of students who get 98 marks is 8 students.
• The number of students who get smaller than 98 is 5 + 2 + 3 + 4 = 14 students.
• The number of students who get greater than 98 is 5 + 6 = 11 students.
• The number of students who get the highest mark is 6 students.
• The number of students who get the lowest mark is 4 students.
Example
The following data shows the weights of 30 students in kilograms. Make a line plot to show these data, and then answer the questions.
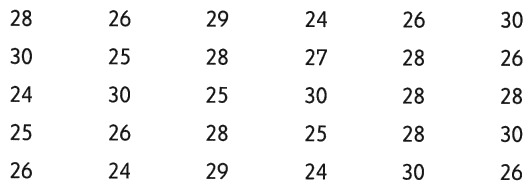
a. How many students weight 25 kilograms ?
b. What is the frequency of 28 in these data ?
c. What weight has the most frequency ?
d. What weight has the least frequency ?
e. How many students weight less than 26 kilograms ?
f. How many students weight more than 27 kilograms ?
Solution
To make a line plot for these data follow the following steps :
First : Determine the lowest and the greatest weight.
• The lowest weight = 24 kilogram.
• The greatest weight = 30 kilogram.
Second : Make a tally table shows how many times each weight appears.
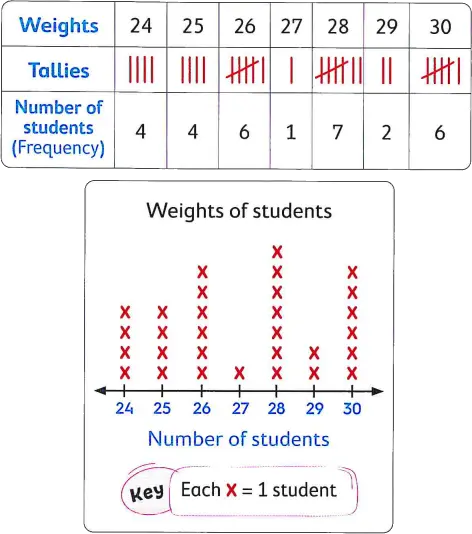
a. 4 students
b. 7 students
c. 28 kilograms
d. 27 kilograms
e. 4 + 4 = 8 students
f. 7 + 2 + 6 = 15 students
The opposite data shows the number of books read by 20 children in a month, complete the tally table, and make a line plot.

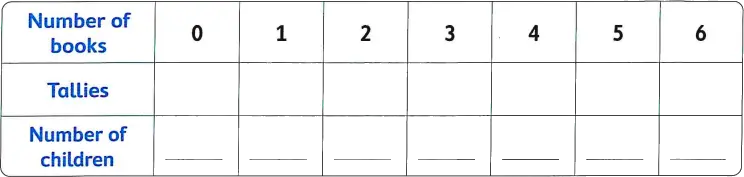

Answer the following questions :
a. How many children read 6 books ?
b. How many children read 4 books ?
c. How many children did not read any book ?
d. How many children read more than 3 books ?
e. How many children read 10 books ?