Lesson
2
More of bar graphs
Learn: Tally marks, tally table and bar graph
• Tally mark is a mark used to record votes or other items.
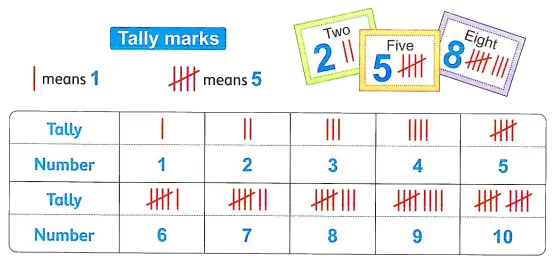
• Tally table is a table uses tally marks to record data.
Example ①
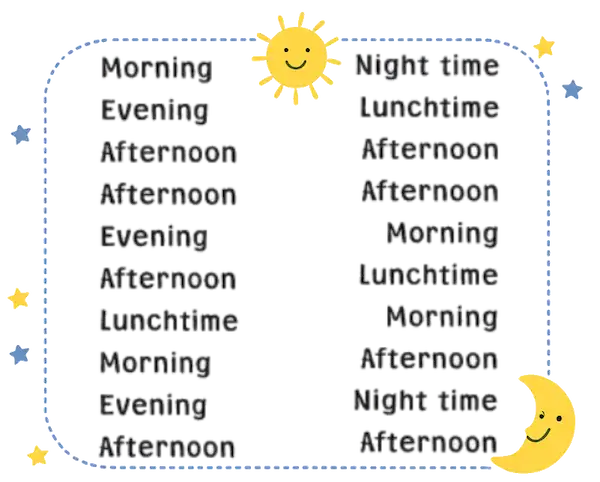
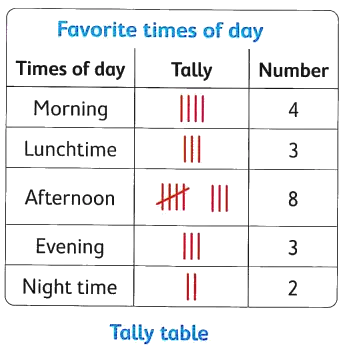
This a survey about favorite time of a day. Make a tally table and then use it to make a bar graph.
Solution

• Bar graph is a graph that uses bars to show data.
• Each bar graph has a scale which is the numbers that show the units used on a bar graph.
Check
Complete the tally table. Color the graph to show data, then answer the questions.
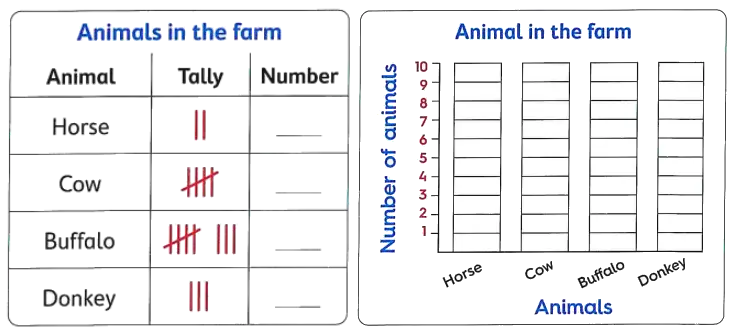
• What is the number of cows in the farm ?
• Which animal has the greatest number ?
• Which animal has the least number ?
• How many animals are there in the farm ?
Notes for parents
- Ask your child to use tally marks to count the number of girls and the number of boys in his/her family.
- Ask your child to survey another favorite such as favorite animals and organize his/her data using tally table.