Lessons
6 to 8
Representing data with a scale of 2
Representing data with a scale of 10
Bar graph
Pre-study
Skip counting by 2s
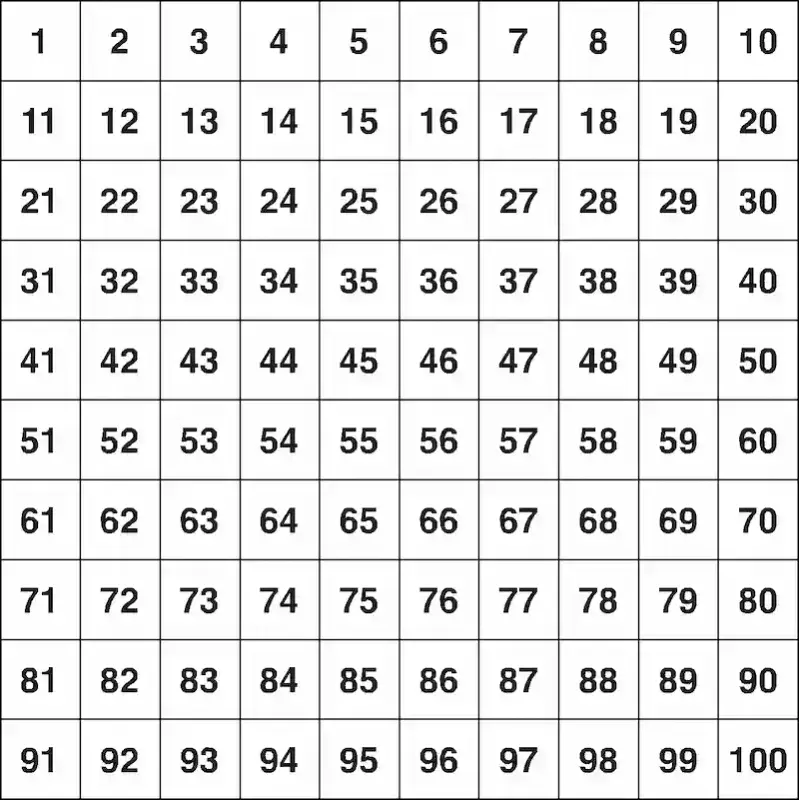
Start on 2 on the chart. Count forward by 2s.
2,
4,
6,
8,
10,
12, ...
You skipped 3, 5, 7, 9, 11, ...
Practice:
• Start on 6. Skip count by 2s. Write the numbers
,
,
,
,
,
,
Skip counting by 10s
Start on 10 on the chart. Count forward by 10s.
10,
20,
30,
40,
50,
60, ...
You simply move down one row each time.
Practice:
• Start on 4. Skip count by 10s. Write the numbers
,
,
,
,
,
,

Learn 1: Representing data with a scale of 2
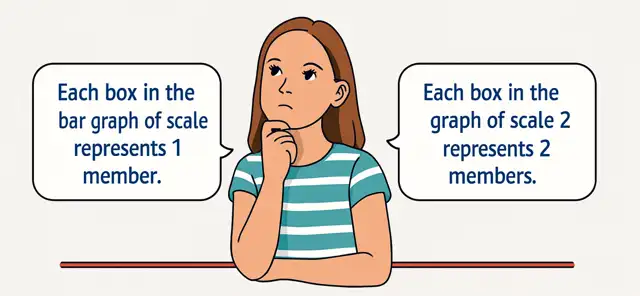
You can use any scale for a bar graph. Here are two bar graphs that show the same data with different scales.
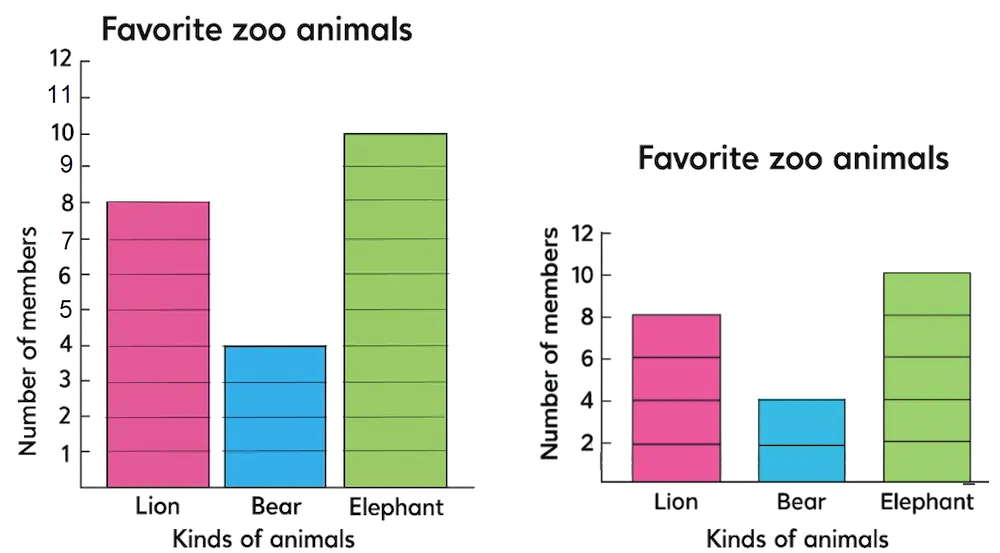
- • Which animal is liked the least ? Bear
- • Which animal is liked the most ? Elephant
- • How many people liked lion and bear ? 8 + 4 = 12
- • How many people liked elephant more than bear ? 10 - 4 = 6
Learn 2: Representing data with a scale of 10
The following table is a voted table of 300 people for their favorite ice cream flavor.
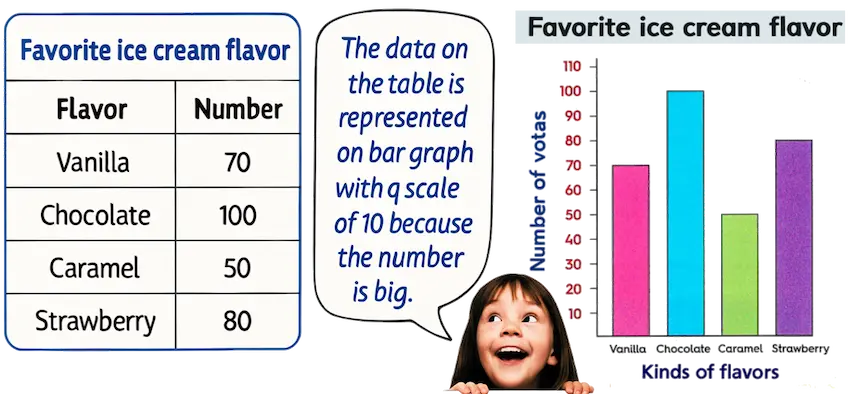
- • Which ice cream flavor is liked the least ? Caramel
- • Which ice cream flavor is liked the most ? Chocolate
- • How many votes in all liked vanilla and chocolate ? 70 + 100 = 170
- • How many more votes liked strawberry than vanilla ? 80 - 70 = 10
Check
Use the bar graph to answer the questions.
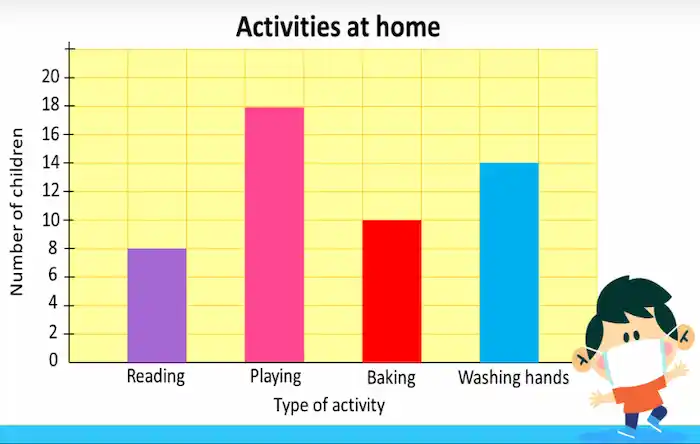
1. How many children chose 'Reading'?
2. Which activity was chosen by the most children?
3. How many children chose 'Baking'?
4. Which activity was chosen by the fewest (least) children?
5. How many more children chose 'Playing' than 'Baking'?
Notes for parents
- Encourage your child to use the number chart to practice skip counting by 2s and 10s, a key skill for this lesson.
- Discuss why we sometimes use a scale of 2 or 10 on a graph instead of counting by 1s, especially with larger numbers.
- Explain how the same data is represented differently on bar graphs with different scales.
- Work together to solve the problems on the page using the number chart and graphs as tools.