Lessons
1 to 3
Reading data
Collecting and representing data
Comparing data
A bar graph is a chart that uses bars to show amounts. It helps us see and compare different numbers easily!
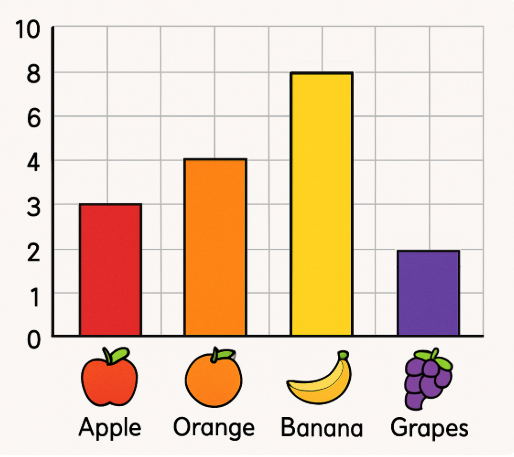
• The number of 🍎 is3
• The number of 🍊 is4
• The number of 🍌 is8
• The number of 🍇 is2
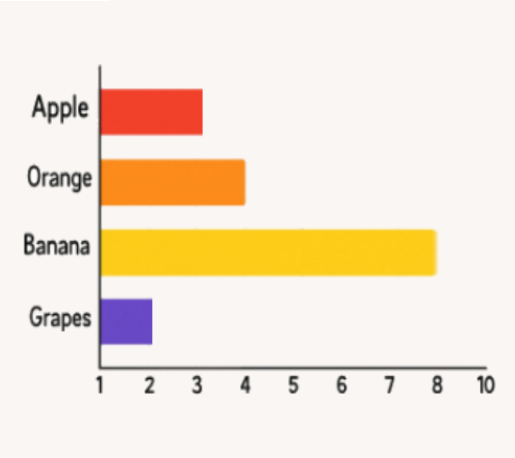
A horizontal bar graph is another version where the bars go across the graph instead of up. The information is the same!
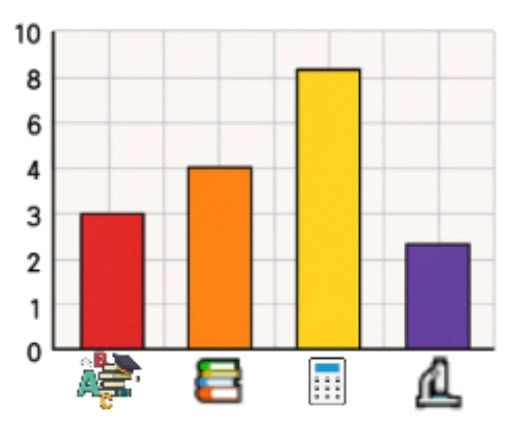
• The number of 📚 is greater than the number of 🔬
• The most favorite subject is 📚
• The least favorite subject is 🔬
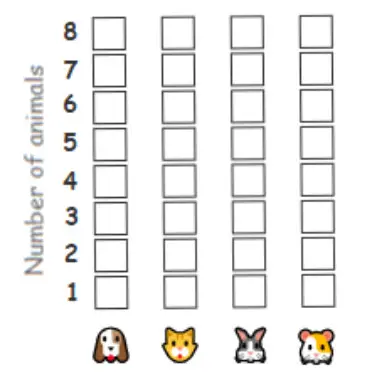
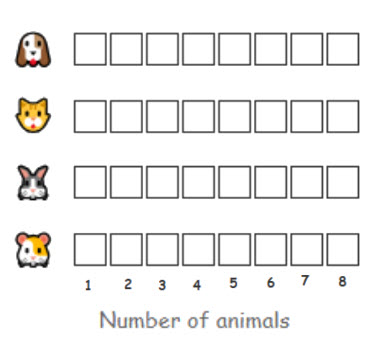
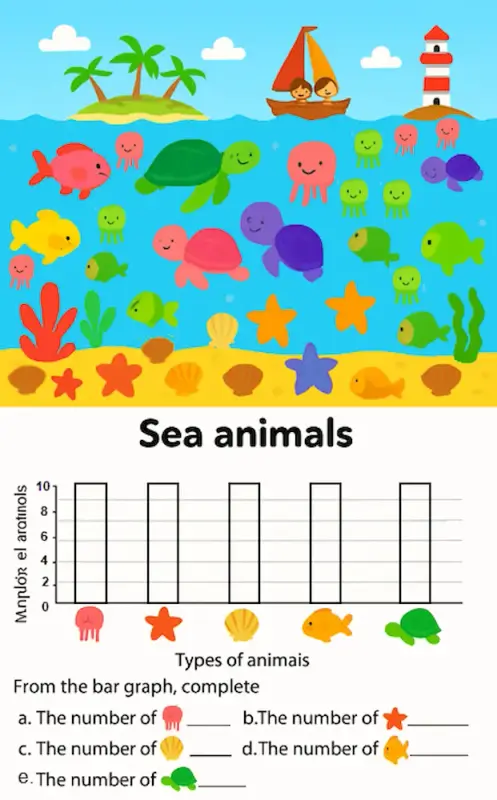
Count the animals, then color one box for each animal in both the vertical and horizontal graphs.
Notes for parents
- Help your child convert the same information from the vertical format into the horizontal format.
- Make sure that your child starts coloring from the bottom for vertical graphs, and from the left for horizontal graphs.